

Population Standard Deviation Calculator
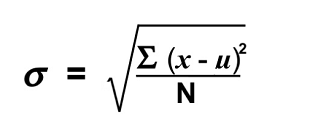
Population Standard Deviation Formula
Steps to Calculate Popluation Standard Deviation
The population standard deviation is similar to the calculation for sample standard deviation, except that when calculating population n is equal to the sum of the number of values in the data set, whereas when dealing with a sample you subtract 1 from the number of data points in the data set. I may be getting ahead of myself... but this will make sense later in the instructions below.
In an effort to have a little fun with this sample problem and explanation: As a new graduate you have recently been employed by Math Geeks Inc to complete a data analysis on the number of beer pong cups at each fraternity on campus. There are 10 fraternity's and based on the data you collected you found that all the frat houses had the following number of cups:
2, 3, 5, 5, 6, 8, 8, 9, 9, 10
Find the Mean
The first step to is to find the sum of all the data points in the dataset. Then find the mean, also referred to as average and represented by the symbol μ. To calculate the average you sum the values then divide by the number of values in the dataset. Based on the data you collected, step one is as follows:
2, 3, 5, 5, 6, 8, 8, 9, 9, 10 ÷ 10 = 6.5
The mean of these 10 data points is 6.5
Find the Deviation From the Mean and Square It
This step could really be broken into two steps. The first part is to find the deviation from the mean of each value in the dataset. This is done by subtracting the mean calculated in the previous step from each data point. For example, the first data point (above) is 2, so we would subtract 6.5 from it (2 - 6.5 = -4.5).
The second part of this step is to square the results from part one, so -4.5 then gets square; -4.52 = 20.25. Because we are squaring the numbers we don't need to be too concerned with negative numbers, as they will become positive once squared.
(2-6.5)= -4.5 Then: (-4.5)^2= 20.25
(5-6.5)= -1.5 Then: (-1.5)^2= 2.25
(6-6.5)= -.5 Then: (-.5)^2= .25
(8-6.5)= 1.5 Then: (1.5)^2= 2.25
(9-6.5)= 2.5 Then: (2.5)^2= 6.25
(3-6.5)= -3.5 Then: (-3.5)^2= 12.25
(5-6.5)= -1.5 Then: (-1.5)^2= 2.25
(8-6.5)= 1.5 Then: (1.5)^2= 2.25
(9-6.5)= 2.5 Then: (2.5)^2= 6.25
(10-6.5)= 3.5 Then: (3.5)^2= 12.25
Sum Values and Divide
Next you will need to find the average of the numbers from the previous step. So we will add all the values then divide by 10 (note, we are dividing by 10 because there are 10 numbers in our dataset).
(20.25 + 12.25 + 2.25 + 2.25 + .25 + 2.25 + 2.25 + 6.25 + 6.25 + 12.25) ÷ 10 = 6.65
Step 4. Square root
You are almost there! The final step is to take the square root of the number calculated in the previous step. In this case 6.65. The square root of 6.65 is 2.5788. 2.58 (rounded) is your population standard deviation. What this means is if we are looking at one standard deviation from the mean, based on the data points provided in step one, there is a 68% probability that a frat house will have that many beer pong cups. Stated another way, the average frat house has 6.5 beer pong cups, so there is a 68% probability that if you randomly walked into a frat house there would be between 3.9 and 9.1 beer pong cups (6.5 - 2.6 = 3.9 and 6.5 + 2.6 = 9.1)... and since we likely won't have 3.9 or 9.1 cups it is safe to round and say between 4 and 9.
For additional information and explanation visit Standard Deviation Explanation
&nbps;
Standard Deviation Video Tutorial
The following video provides an easy to understand overview of how to calculate standard deviation.