

Sample Standard Deviation Calculator
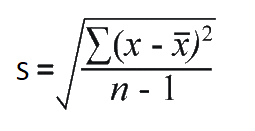
Sample Standard Deviation Equation
Sample Standard Deviation Calculation Steps
Having a little fun here with this example. As a new data analyst at Shoeburger Corp. you have been tasked with doing a statistical analysis on how many Famous Shoeburger sandwiches are sold at each location for the food chain. Management wants to know how many are sold at each location on a monthly basis so they can decide which markets could use a boost with a new advertising campaign.
Corporate has provided you with the following data, which represents how many of their Famous Shoeburger sandwiches have been sold at locations in your state, for a given month. Note that there are 8 locations in the state.
23, 34, 14, 23, 12, 33, 13, 16
Find the Sample Mean
The first step is to find the mean for the values you were provided. The mean is also referred to as average, or it can be represented by the symbol x̄ (when dealing with a sample we use x̄ and when solving for population we use μ to represent the mean). To find the mean you add all the numbers together and divide the total by how many numbers there are. In this example there are 8 numbers, or data points.
23 + 34 + 14 + 23 + 12 + 33 + 13 + 16 = 168 ÷ 8 = 21
Based on the data you were provided, the mean is 21.
Establish Deviation From the Mean
The next step is to determine the deviation from the mean, or put another way, how far each data point is from the average. To do this, you subtract the mean (calculated in the previous step) from each data point that you were originally provided (in this example - 23, 34, 14, 23, 12, 33, 13, and 16).
1. (23 - 21) = 2
2. (34 - 21) = 13
3. (14 - 21) = -7
4. (23 - 21) = 2
5. (12 - 21) = -9
6. (33 - 21) = 12
7. (13 - 21) = -8
8. (16 - 21) = -5
Square the Deviations
Once you have the mean deviation of each data point in your data set, you will want to square each value. Note that it doesn't matter if the deviation is positive or negative. When you square a negative number it becomes positive. Based on the values you calculated in the previous step, you will now have the following:
1. 2² = 4
2. 13² = 169
3. -7² = 49
4. 2² = 4
5. -9² = 81
6. 12² = 144
7. -8² = 64
8. -5² = 25
Sum the Squares
In this next step you will want to add each of the squared values from the previous step (this step is really that easy).
4 + 169 + 49 + 4 + 81 + 144 + 64 + 25 = 540
Divide the Sum of Squares by Number of Values Minus 1
With the sum of squares calculated, you will now want to divide by the number of values in your data set minus 1. This is important! This is what makes finding the sample standard deviation different from the population standard deviation. Because our original dataset included 8 values (or data points), here we will subtract 1 from 8
Again, because there are 8 values in our dataset, and we are looking at a sample, you will divide the sum of squares by 7;
540 ÷ 7 = 77.1429
Find the Square Root
The final step of the calculating sample standard deviation is to square the value from the previous step.
√ 77.1429 = 8.7831
Based on the 8 values in the dataset that you were provided, the standard deviation is 8.7831. And that is it, you just walked through the process of doing a basic statistical analysis.
Conclusion
What this means is, of the sales numbers provided in the example above:
1. The average sales for the Famous Shoeburger sandwich is 21. On average each location sells 21 of these sandwiches.
2. The standard deviation for the number of sandwiches sold at each location is 8.8 (rounded).
For this to take on "full" meaning, we need to understand what the standard deviation represents. One standard deviation represents a 68% probability of a number ocurring within the dataset. In the example above, 1 standard deviation is 21 + 8.8 and 21 - 8.8; so there is a 68% probability that a location will sell between 12.2 and 29.8 of the Famous Shoeburger sandwiches for a given month.
See also Explanation of Standard Deviation for additional details.