What is Supply Chain Forecasting?
In Demand Forecasting historical data is used to establish average demand. Based on this average a forecasting method is used to project future demand. In the supply chain the primary objective of forecasting is inventory optimization. Due to the costs associated with placing orders, carrying inventory, movement of inventory, etc... a business wants to order just the right amount of inventory, at just the right time, with the least cost possible.
Businesses use the demand forecast to make many important business decisions. The primary reason is to ensure that the business can meet customer expectations (what customers want, when and where they want it), but this information is also used to analyze business related requirements as well; such as, for planning personnel needs (hiring and firing), cash flow evaluation, and to evaluate warehousing requirements, to name a few.
There are three primary strategies, or approaches, to demand forecasting;
1. Qualitative: Typically used when there isn't enough data available to quantify projections
2. Time-Series: There are many different approaches to time-series forecasting, with subsets for each approach. The main idea behind Time-Series forecasting is to evaluate historical sales data and forecast based on this data. Many businesses use this approach because it can be implemented fairly easily with accessible raw data. This approach is also easy to implement with an Excel spreadsheet.
3. Causal Models: This is a more complex approach to forecasting and it takes many different variables into consideration to find data correlations/associations.
Typically it is the responsibility of the demand forecasting team to establish inventory levels for an organization. The most important part of this job is analysis; know your data, review it, check it, research, and ask the product SME's (subject matter experts) questions to confirm any anomalies that you see. Once the data looks good, at least as good as it can be since organizations are living entities and data continuously changes, you will want to prepare the data for a forecast. In this article we're not going to dig into the details of shaping data or review the different fields of data you may want to evaluate, we're going to assume you have all the basics and our focus will be on the steps of establishing a Target Stock Level (TSL).
The following are the four sequential steps that typically occur in a basic demand forecasting process to establish a TSL.
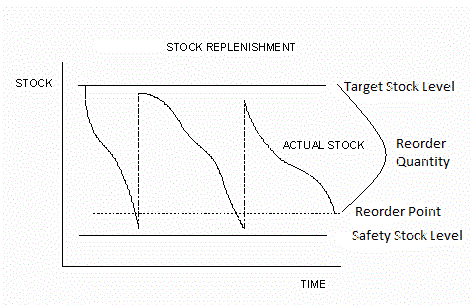
Safety Stock Level
There are many ways to set a Safety Stock (SSL). The process, or method used, is typically based on managements tolerance for risk, the industry, the importance of maintaining stock (for example if a Service Level Agreement is in place), and the cost of lost sales for a particular product. A basic approach is just taking Lead Time × Average Demand, but it can get a lot more complicated if the organization wants to maintain a specific fill-rate or service level. Taking this into consideration will require establishing a the fill-rate and a corresponding z-score. The purpose of SSL is to mitigate risk by ensuring (or attempting to ensure) an inventory position will not reach zero and cause a back-order, or worse a lost sale oppportunity. SSL assumes there is variability in demand (and there almost ALWAYS is), and that there is variability in Lead Time (and there always is!)... so the idea is to buy enough to cover this variability and hope there aren't any significant anomalies; i.e. a spike in demand while there is a catastrophic event with a supplier that can't get you an order within the average timeframe.
Reorder Point
A Reorder Point (ROQ) will always be greater than your SSL, because it takes SSL into consideration in the formula. This inventory point seeks to mitigate risk (similar to SSL) of a stock-out, but more importantly when inventory reaches this point it will trigger organizational buyers to go out for a buy. The idea behind this calculation is to order, knowing your inventory will drop below this point, but your inventory should not dip below your SSL. The key to this area is this is where you buy, but it does not tell you how much to buy... this is where EOQ comes in.
Economic Order Quantity
The next step in the process is to establish Economic Order Quantity (also referred to as Reorder Quantity... or EOQ, or ROQ) is the quantity of a product that you want to buy once you reach your Reorder Point. An EOQ formula takes into consideration how much it costs to hold (or shelve) inventory, how much it costs to place an order, and average demand. It is important to note that to determine your holding cost you must know the acquisition cost (cost per unit) and the cost of holding inventory. The cost of holding inventory is a percentage and usually is the result of a financial analysis; holding costs can vary widely, but a general rule of thumb is 10-20%. So, to calculate holding cost you would take cost per unit × X%. By taking these attributes into consideration, the model seeks to ensure you don't buy too much (because it's expensive to hold onto inventory, and we have space constraints in a warehouse or store), while ensuring an organization isn't spending too much on placing constant orders... it seeks the "just right" amount of inventory. EOQ Calculator is a good place to review additional information and has a useful calculator.
Target Stocking Level
The final step is to establish a Target Stocking Level (TSL). A TSL is simply ROQ + ROP; it is all the units from zero to your ROP plus the quantity of units you need to buy when you hit ROP; you never want to have more than TSL in stock as it would defeat the purpose of the previous steps seeking to optimize your inventory.


